Formatting and editing LiveReports
PERMISSIONS Users with security levels that allow the creation of LiveReports. Any security level in Autotask can be configured with this permission. Refer to Configure access to LiveReports Designer.
PERMISSIONS Access to the report folder that contains the report
NAVIGATION Left Navigation Menu > Admin > Admin Categories > Features & Settings > LiveReports > LiveReports Designer > right-click an existing report > Edit or on the Layout tab of the New Report wizard, click Finish
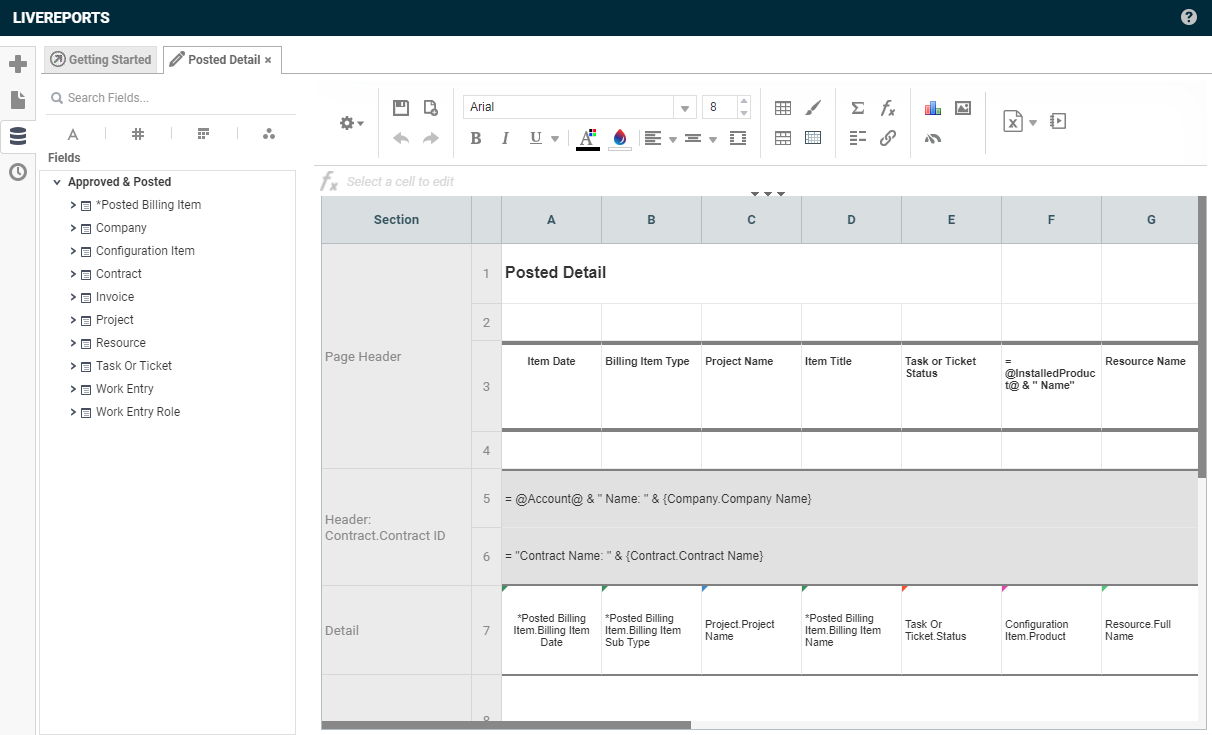
The LiveReports editor has several functions:
- If you have the required permissions, you can make changes to all the settings of an existing report that were selected in the LiveReports wizard
- You can apply formatting to cells and add images, charts and other visuals
- You can structure the report by adding sections that group data
To open the page, use the path(s) in the Security and navigation section above. When you create a new Standard Report, the report editor page will open automatically when you click Finish.
For Express Reports, the LiveReport wizard includes basic formatting options in the Preview pane of the Layout tab.
You can do the following:
| Name | Description |
|---|---|
Fields Pane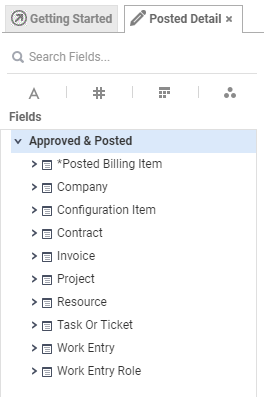 |
|
| Search Fields | Search the list of fields by name or partial name. Filter the list of fields in the pane by selecting the Text , Numeric , Numeric , Date/Time , Date/Time or Other or Other icons. Click again on the icon to remove the filter. icons. Click again on the icon to remove the filter. |
| Fields | This list contains all subcategories selected in the wizard and available fields associated with those subcategories. Fields can be added to the report by dragging and dropping them to the desired location, or by selecting a location in the report and double-clicking on the field name to add it there. To change the list of sub-categories or delete all subcategories and select new ones, refer to Categories under the Options menu. |
Section Editor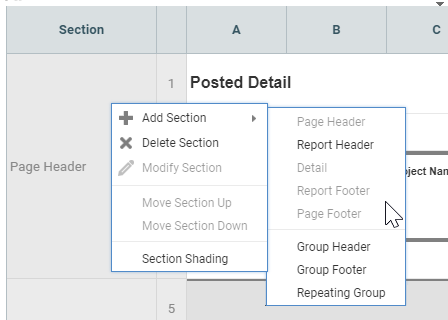 |
|
| Section Editor | In this area, you can add, edit and delete report sections. Refer to Sections, rows, and columns. |
Column Editor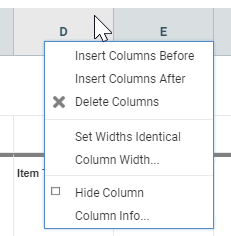 |
|
| Column Editor | From this menu, you insert and delete columns, manage column width, and hide or un-hide columns. Select Column Information to add a label to the column or apply a sort. TIP Cell references auto-update when you insert new columns. |
Edit Options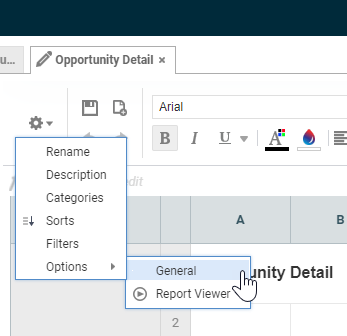 |
|
| Rename | Rename the report and optionally change the folder it is saved in. Refer to Name tab. |
| Description | Edit the report description. Refer to Name tab. |
| Categories | Edits the list of available categories from which fields can be selected. If all categories are deleted, you can even select a new category. You are effectively starting over with the report. Refer to Categories tab. |
| Sorts | Edit the sorts in the report. Refer to Sorts tab. |
| Filters | Edit the filters in the report. Refer to Filters tab. |
| Options | Edit the output options for the report. For more information, refer to Setting report output options. |
Miscellaneous |
|
| Various Icons | Click icons to Save Report, Create a New Report, Undo (Ctrl+Z), and Redo (Ctrol+Y). |
Text and Cell Formatting |
|
 Format Cells Format Cells |
Allows you to apply a number format and a border style to a cell, and to apply conditional formatting. Conditional formatting is not available in Express reports. To apply conditional formatting, select the cell and click the Format Cells icon. Then click the Conditional tab. 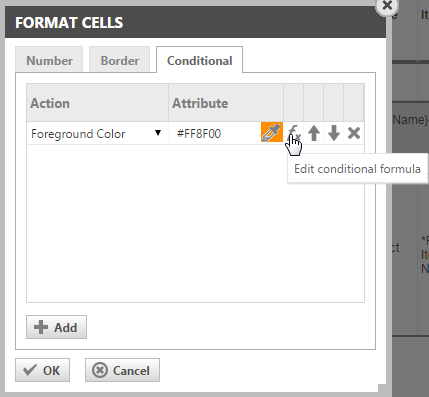 If no conditions are present, click Add. Click the Edit Conditional Format symbol. The Formula Editor window opens. 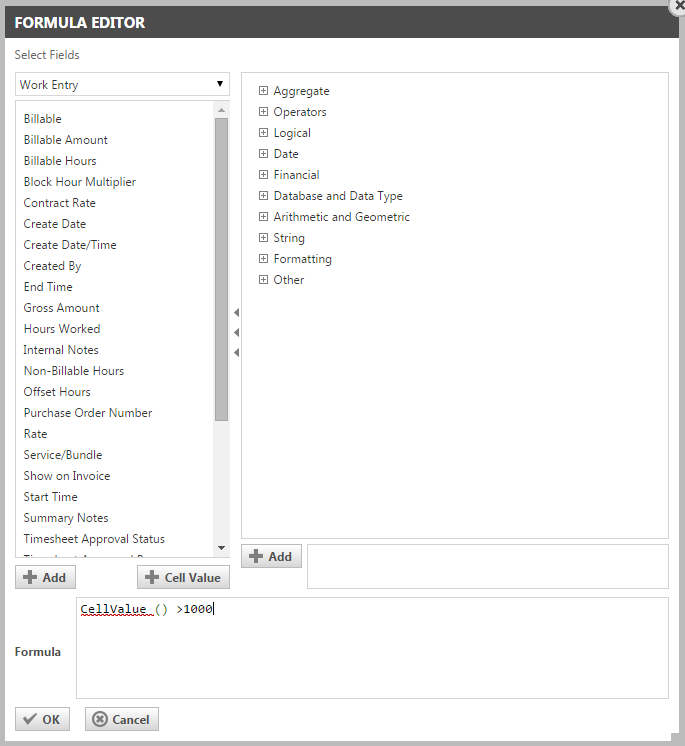 To apply conditional formatting based on the cell value of the selected cell, click the + Cell Value button and enter an operator (=, >, <) and a value. You can of course also enter a formula in the usual way. Refer to LiveReports formulas. TIP For best performance, use the + Cell Value button. TIP This icon, |
 Format Paintbrush Format Paintbrush(not available in Express Reports) |
To copy the formatting of one cell to another, select the formatted cell, click the Format Paintbrush icon, and then click the cell you want to format. |
| Other Icons | Highlight a cell or multiple cells (Shift + Click or CTRL + Click for non-sequential cells) and click an icon to select a font, format the text, justify and wrap the text in the cells, determine number formatting, and format cell borders and colors. The formatting tools will be familiar to anyone who has used formatting tools in Microsoft Excel. Hover over an icon to show the name of the tool. The merge cells, split cells, and wrap text options are not available in Express reports. |
Tools These tools are not available in Express reports. These tools are not available in Express reports. |
|
| Autosum | Sums the column of the cell being highlighted. For more information, refer to Summing columns. |
| Formula Editor | Create a formula by selecting the desired functions. For more information on Functions, refer to LiveReports functions for formulas. TIP You can use the Hyperlink function to create a hyperlink in the cell to open tickets, organizations, and other items in Autotask. This function is described under HYPERLINK in LiveReports functions for formulas. TIP For HTML reports only: HTML reports can link to and open selected items in Autotask, like tickets and time entries, with a "Link" field, for example, Ticket Number Link, instead of a cell formula. Link fields work only in HTML reports. Check the Data Field Dictionary to find available Link fields. NOTE When a link generated by a formula or a link field attempts to open an item in Autotask, the logged in user's security level permissions control access to the item and associated data. |
| Suppress Duplicate Values | Suppresses duplicate values in the selected cell. This is a simple check of whether the current value of the cell is the same as the previous value. If so, the value is not displayed. NOTE You can also suppress duplicate data by using the Suppress Duplicates option on the Categories tab. |
| Linked Report | Link another report to this report. A link icon in the cell  indicates that the cell is already linked to another report. Refer to Linking a report to another report. indicates that the cell is already linked to another report. Refer to Linking a report to another report. |
| Chart Wizard | Insert a chart into your report. Refer to Using the Chart Wizard. |
| Insert Image in active Cell | Inserts a picture in the cell. NOTE If you modify the picture, you must add it again to the cell. Pictures do not export to Microsoft Excel, as Excel does not support placing images in cells. |
| Gauge Wizard | Insert a gauge into your report. Refer to Using the Gauge Wizard. |
Export and Run Report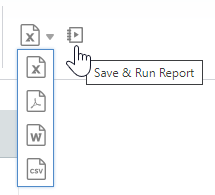 |
|
| Export Report | Click to save and export the report to the file formats enabled in the Report Options > Options > General window. If no export options are allowed, the Export button is not displayed. Refer to Setting report output options. |
| Save & Run Report | Allows you to run the report in HTML if Allow Report Execution in Viewer is set to True in the Report Options > Options > General window. |
Right-click menu options
You can right-click a cell to access the following options: Cut, Copy, Paste, Clear, Format Cells, and Insert. You can insert images, charts, gauges, and formulas. Charts can only be inserted in Group Headers and Footers, or Report Headers and Footers.
